Multi-stream benchmarking and live network interface monitoring for media production storage.
Traditional storage benchmarks test one machine in isolation. They tell you how fast your Mac can read or write to the NAS — but that's not the question that matters in a shared storage environment. The question is: how does the NAS perform when your whole team is hitting it at the same time?
A single-client benchmark might show 1,200 MB/s on a 10 GbE link. But put three editors, an ingest station, and a proxy job on the same NAS simultaneously, and actual per-client throughput might drop to a fraction of that. The bottleneck could be the storage controller, the network, or contention between clients — and a single-client test can't tell you which.
ShareBench tests the NAS under load, in a controlled and reproducible context. Coordinate multiple Macs in a synchronized swarm test, configure multi-stream I/O to simulate real editing workloads, and monitor the network interfaces carrying the traffic — so you can see exactly where performance breaks down and why.
Click the location selector in the toolbar to choose a benchmark target. ShareBench automatically detects mounted SMB, NFS, AFP, WebDAV, StorNext, and LucidLink shares, as well as local volumes. Select any accessible volume to begin testing.
If your share isn't listed, make sure it's mounted in Finder first (Go → Connect to Server). ShareBench can only test volumes that macOS has already mounted.
| Parameter | Description |
|---|---|
| Bytes Per Cycle | Total data written and/or read per test cycle. Larger values give more sustained measurements but take longer. Typical values: 1–8 GB. |
| Cycles | Number of times to repeat the test. Multiple cycles reveal consistency — if throughput varies significantly between cycles, something is contending for resources. |
| Streams | Number of parallel read or write streams. Each stream writes to a separate file simultaneously, simulating multi-track AV editing workflows where multiple media files are accessed in parallel. More streams are generally needed to saturate faster NICs and storage, but adding streams can also decrease overall performance due to I/O contention — especially in multi-client tests. |
| Chunk Size | Size of each I/O operation. Larger chunks (1–4 MB) are typical for media workflows with large sequential files. Smaller chunks (64–256 KB) simulate frame-based sequential access patterns, but note that this tests sequential small-file I/O, not random access performance. |
| Phases | Whether to run Write only, Read only, or Write + Read. Write + Read tests the full round-trip: write the data, then read it back. |
Stream count does not scale predictably or linearly — adding streams can increase total throughput up to a point, but beyond that point, I/O contention can actually decrease overall performance. The "right" count depends on what you're measuring:
When combining high stream counts with multi-client swarm tests, be aware that the total I/O load can exceed what the storage or network can handle gracefully, resulting in lower per-stream and sometimes lower total throughput than fewer streams.
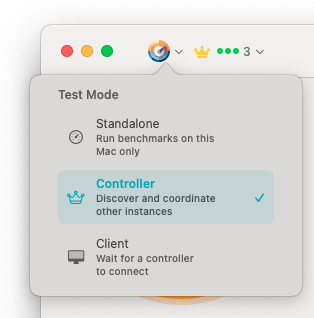
Three operating modes: Standalone for single-Mac tests, Controller to orchestrate swarm tests, Client to participate in them.
Run benchmarks on this Mac only. This is the default mode and works exactly like a traditional storage benchmark — you configure the test, run it, and see results locally.
Discover and coordinate other ShareBench instances on the network. The controller pushes test configuration to all connected clients, starts them simultaneously, and collects aggregated results.
Wait for a controller to connect. Once paired, the client receives test configuration from the controller and runs on command. Results are reported back to the controller automatically.
Swarm testing is ShareBench's most powerful feature. Instead of benchmarking from one machine and extrapolating, you can measure what actually happens when multiple workstations hit the same storage simultaneously.
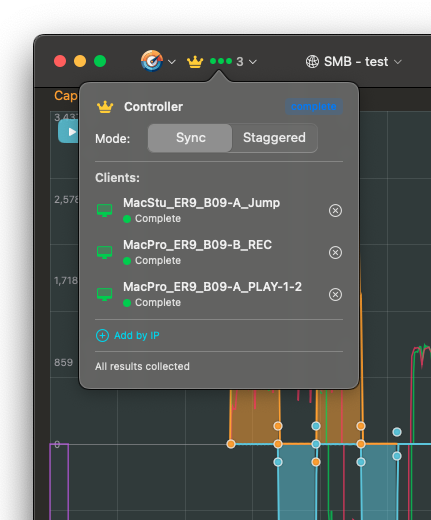
Controller view with connected clients. Status badges show each client's state: waiting, authenticated, ready, testing, or complete.
Multi-client connections are protected by a shared secret configured in Preferences. All participating Macs must use the same secret to connect. The default secret works out of the box for quick tests on trusted networks, but if you change it on the controller, you must set the same value on every client before connecting.
If Bonjour/mDNS is unavailable on your network (common in enterprise environments with mDNS filtering), clients can be added manually by IP address. Each client in Client mode displays its IP and port — enter these on the controller using Add by IP to connect directly.
All clients start their test cycles at the same time. This creates maximum concurrent load and shows worst-case contention. Use this to stress-test storage capacity.
Clients alternate their I/O phases (even/odd offset). This simulates more realistic production load where not everyone is reading or writing at exactly the same instant.
After a swarm test, the controller displays aggregated results showing total throughput across all clients, as well as per-client breakdown. This is the number that matters for capacity planning: it tells you the actual aggregate throughput your storage delivers under your real workload.
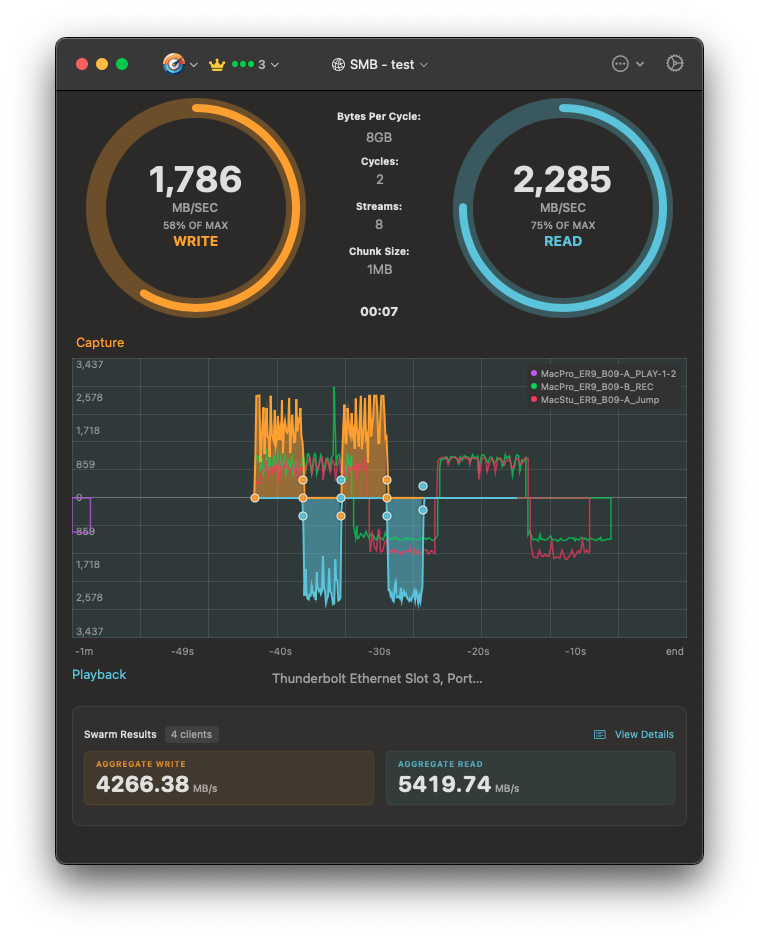
Swarm results: aggregated throughput from four clients with per-client graph overlay and NIC monitoring.
The main graph shows throughput over time. During multi-client tests, each client's traffic is shown as a separate colored line, making it easy to spot clients that are underperforming or experiencing intermittent drops.
The graph supports two views:
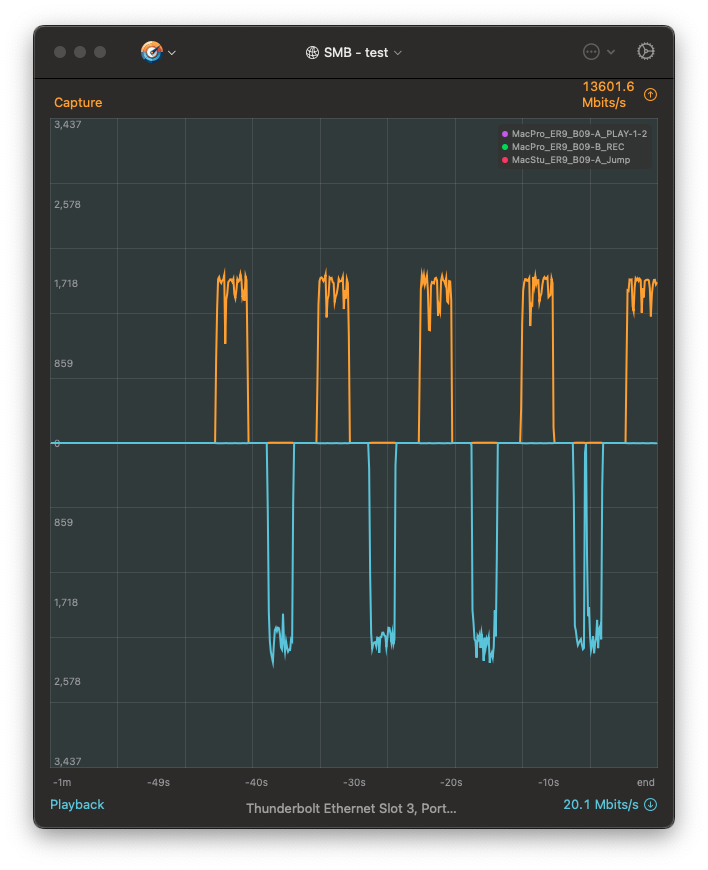
Full-screen interface monitor showing per-NIC throughput with read/write separation. The top half shows outbound (write) traffic, the bottom shows inbound (read).
The interface monitor shows actual throughput on the network interface carrying your benchmark traffic. This is measured at the OS level, not estimated from file I/O, so it includes protocol overhead and reveals the true network cost of your storage operations.
Use the interface selector (below the graph) to switch between detected network interfaces. This is especially useful when comparing performance across different NICs or testing bonded/aggregated connections.
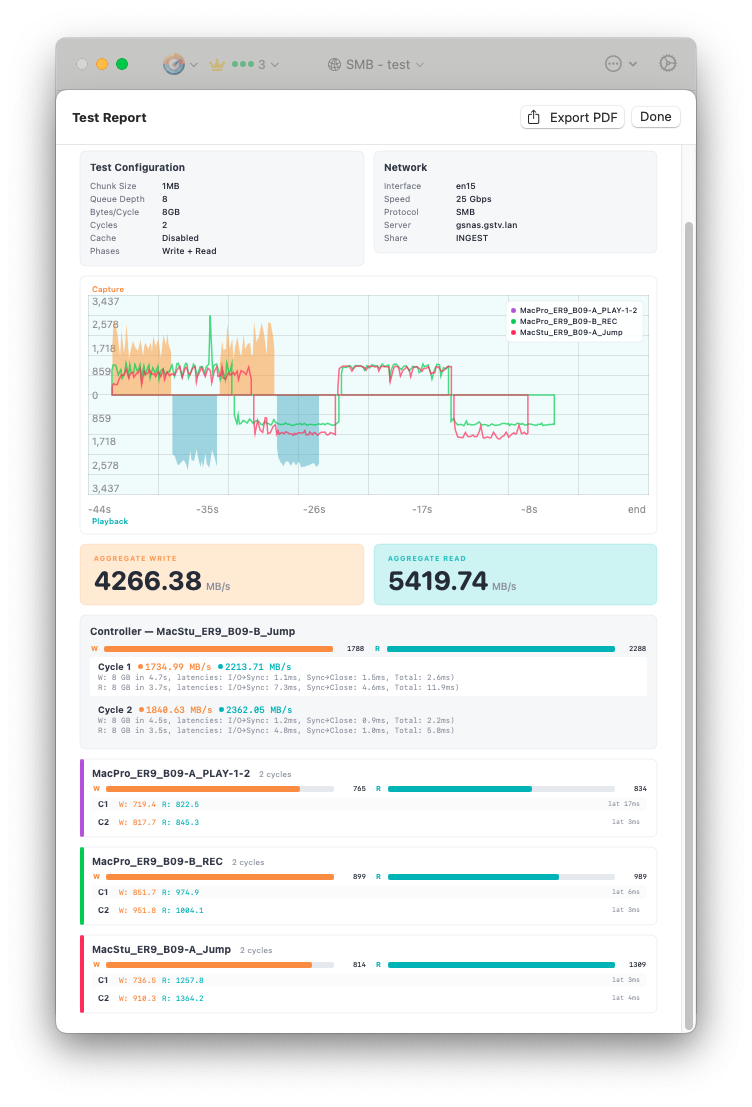
Test report with configuration summary, per-client cycle breakdown, and PDF export.
After a test completes, the results section shows aggregate write and read throughput. Click View Details to see the full test report, including test configuration, network details, per-client per-cycle breakdown, and the performance graph.
Results are saved in a JSON format that's both human-readable and machine-parseable. You can:
Click Export PDF in the test report view to generate a printable report. This is useful for documenting storage performance for capacity planning, presenting to management, or sharing with NAS vendors when troubleshooting performance issues.
There's no universal "good" throughput number — it depends on your storage, network, and workload. What matters is context:
| Network Link | Theoretical Max | Realistic Throughput |
|---|---|---|
| 1 GbE | ~125 MB/s | 100–115 MB/s |
| 10 GbE | ~1,250 MB/s | 900–1,150 MB/s |
| 25 GbE | ~3,125 MB/s | 2,200–2,800 MB/s |
If your single-stream throughput is well below the realistic range for your link speed, check for SMB signing overhead (use Remount to inspect signing status), jumbo frame mismatches, or NAS-side bottlenecks.
Run the same test at 1, 4, 8, and 16 streams and compare total throughput. Stream scaling is not linear — expect diminishing returns:
The goal is to find the stream count that maximizes total throughput for your specific storage and network configuration, then use that as your benchmark baseline.
Compare your single-client multi-stream results with a multi-client swarm test using the same total stream count. If four clients with 2 streams each perform differently than one client with 8 streams, the difference reveals per-client overhead in the storage protocol, network path, or NAS controller.
As of early 2026, 25 GbE NICs paired with enterprise NAS systems represent the high end of Mac-based media storage performance. ShareBench testing has revealed significant differences in achievable throughput depending on macOS version and NIC driver.
Apple's native NIC driver improved substantially in macOS 15 Sequoia. Measured throughput with 25 GbE NICs jumped from the 1,100–1,400 MB/s range observed in Ventura and Sonoma to 2,000–2,400 MB/s in Sequoia — nearly doubling effective bandwidth without any hardware changes.
| Configuration | macOS Ventura/Sonoma | macOS Sequoia+ |
|---|---|---|
| 25 GbE, Apple native driver, 8 streams | 1,100–1,400 MB/s | 2,000–2,400 MB/s |
| 25 GbE, third-party driver (ATTO/Sonnet), 8 streams | 1,200–1,500 MB/s | 1,200–1,500 MB/s |
These numbers were observed with enterprise NAS systems and 8 parallel streams — the minimum stream count needed to fully saturate a 25 GbE link. Single-stream throughput will be significantly lower, which is exactly why multi-stream benchmarking matters for high-bandwidth storage infrastructure.
ShareBench only shows volumes that macOS has already mounted. Mount the share in Finder first (Go → Connect to Server), then return to ShareBench. The location selector will refresh automatically.
The most common cause of failed client participation is no write access to the test location. Each client must manually select the test folder on the shared volume due to Apple's sandbox security requirements — the controller cannot grant this access remotely. Ensure every client has selected a writable location before starting the test.
Enable debug logging in Preferences to capture detailed diagnostic information. Log files can help identify connection issues, timing problems in multi-client tests, or unexpected I/O errors.